1 Motivation
I’ve been inspired by the visualization standard proposed by the IBCS and always tried to pursue such style when doing data visualization stuff. They have a practical guide presented on their website, and imho it’s not really readable and generally downloadable.
Today, when working around an implementation of the IBCS standard for a Power BI report, I came across a wonderful material made by Anton Zhianov. He made the resource more available at:
- his blog: https://antonz.org/dataviz-guide/;
- his github: https://github.com/nalgeon/dataviz.
2 The SUCCESS formula
I created these cards as a brief summary, utilizing the assistance of Gemini 2.5 Pro in Google AI Studio and my preferred Claude 4.0 Sonnet.
While the original version from IBCS sequentially constructs a SUCCESS formula, I am leaning toward the way Anton had presented the rule ~ depicting how I am normally making a chart:
The message to deliver → The canvas to paste the data → The chart to use → Removing redundant things → Condensing more information → Revisiting integrity & unification.
- Action: Structure your narrative with the Situation-Problem-Question framework to provide context and focus.
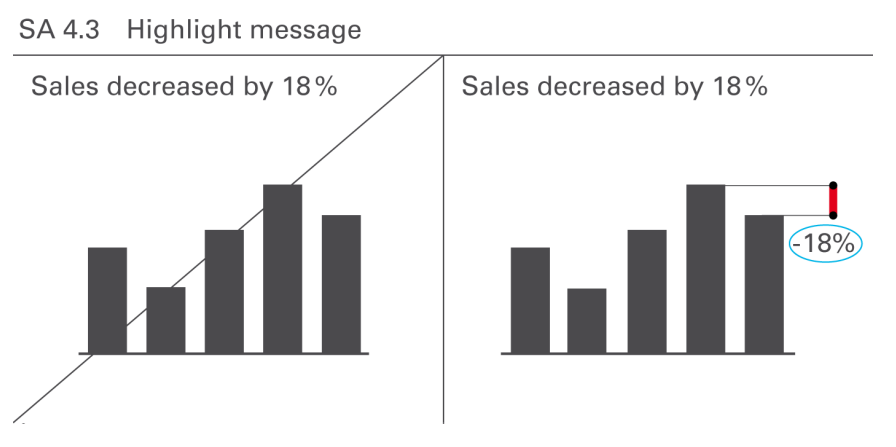
- Action: State your main message—be it a detection, explanation, or suggestion—upfront (Pyramid Principle).
- Trap: Creating "data dumps" that force the audience to find the story themselves.
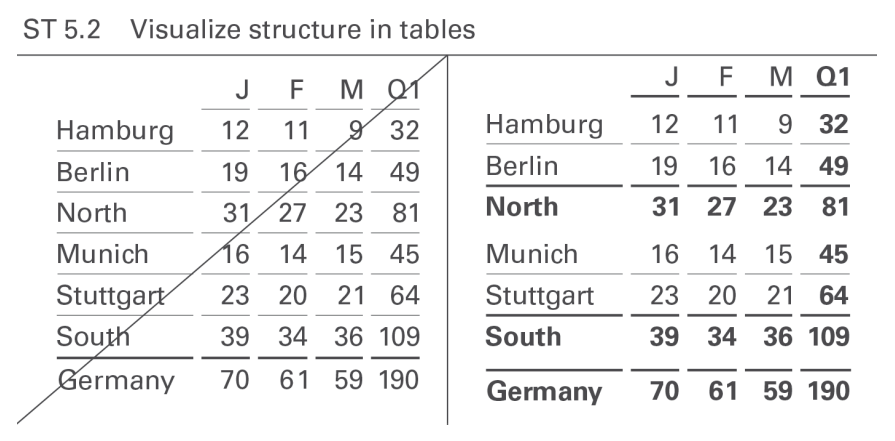
- Action: Ensure all categories are MECE (Mutually Exclusive, Collectively Exhaustive) to avoid confusion and gaps.
- Action: Maintain consistency in wording, item types, and visualizations within any group.
- Trap: Presenting flat lists of information without clear hierarchy or logical flow.
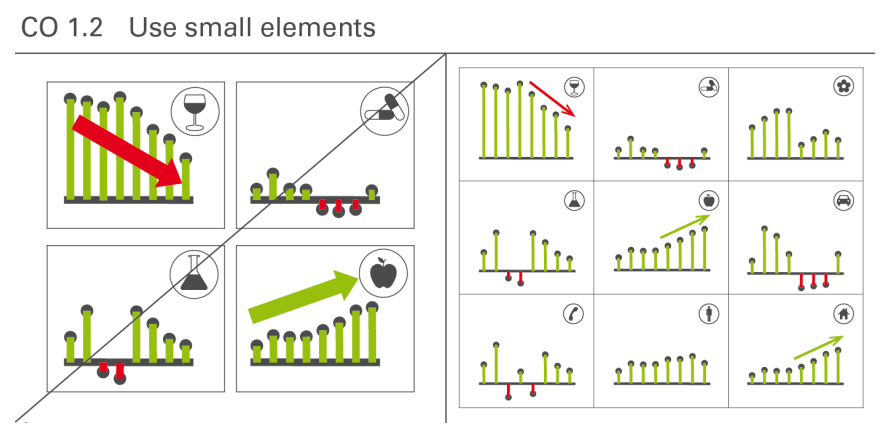
- Action: Use column/line charts for time-series analysis and bar charts for structural comparisons.
- Action: Use tables when users need to look up precise numerical values.
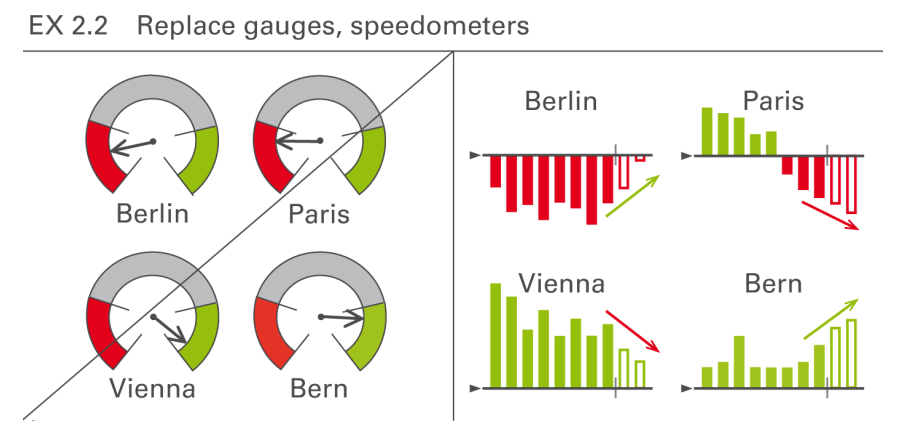
- Trap: Defaulting to visually weak charts like pies, gauges, and radar charts that distort data.
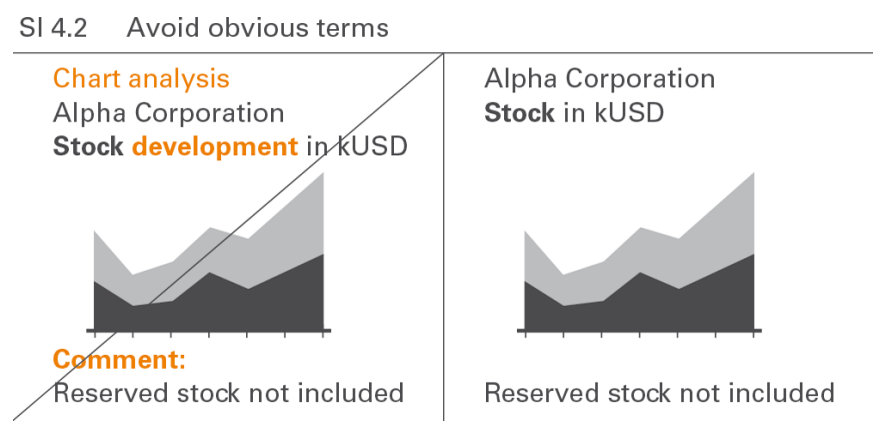
- Action: Maximize the data-ink ratio by removing all decorative elements (shadows, 3D, backgrounds, borders).
- Action: Replace gridlines and axes with direct data labels for a cleaner look.
- Trap: "Chartjunk" that distracts from the core message and reduces clarity.
- Action: Use small multiples to enable easy comparison across many categories at once.
- Action: Embed visuals like sparklines or bars directly into tables to add context without taking up space.
- Trap: Using low-density visuals that force users to flip between pages to connect ideas.
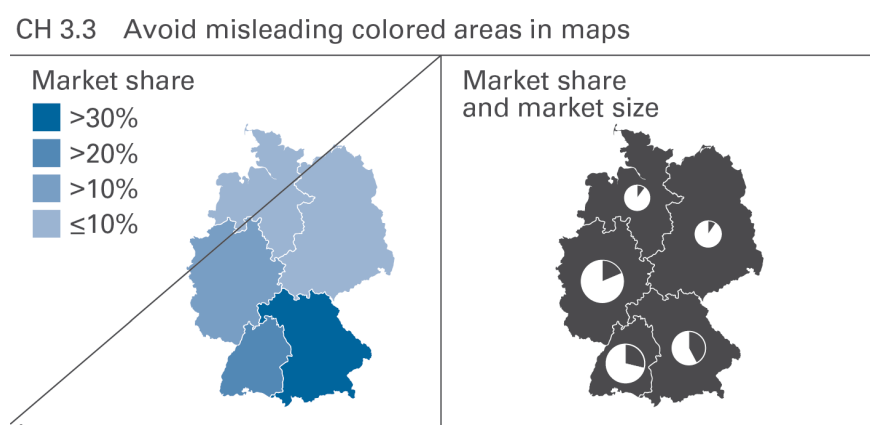
- Rule: Bar and column chart value axes must start at zero to avoid distorting proportions.
- Rule: When using areas (e.g., bubbles), scale the area to the value, not the diameter.
- Action: Use identical scales for all charts on a page that share the same unit.
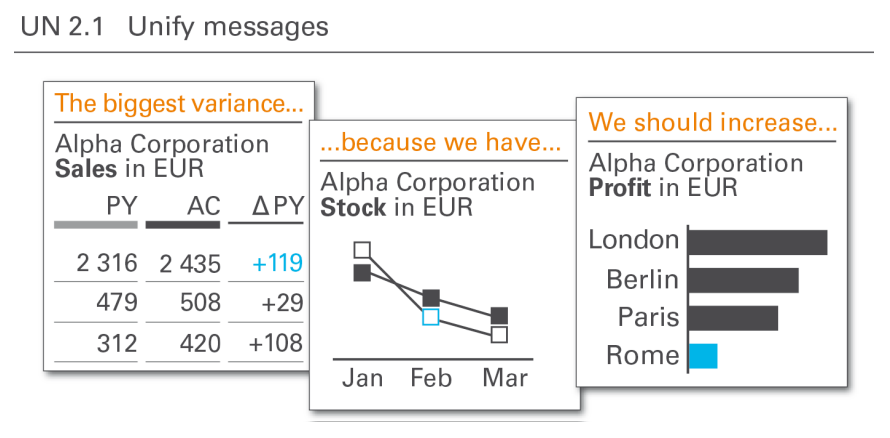
- Notation: Use consistent fills for scenarios: Solid for Actual (AC), Outlined for Plan (PL), Hatched for Forecast (FC).
- Notation: Use Green for positive impacts (e.g., profit up) and Red for negative.
Happy visualizing! happy vibing! - Tuan.